
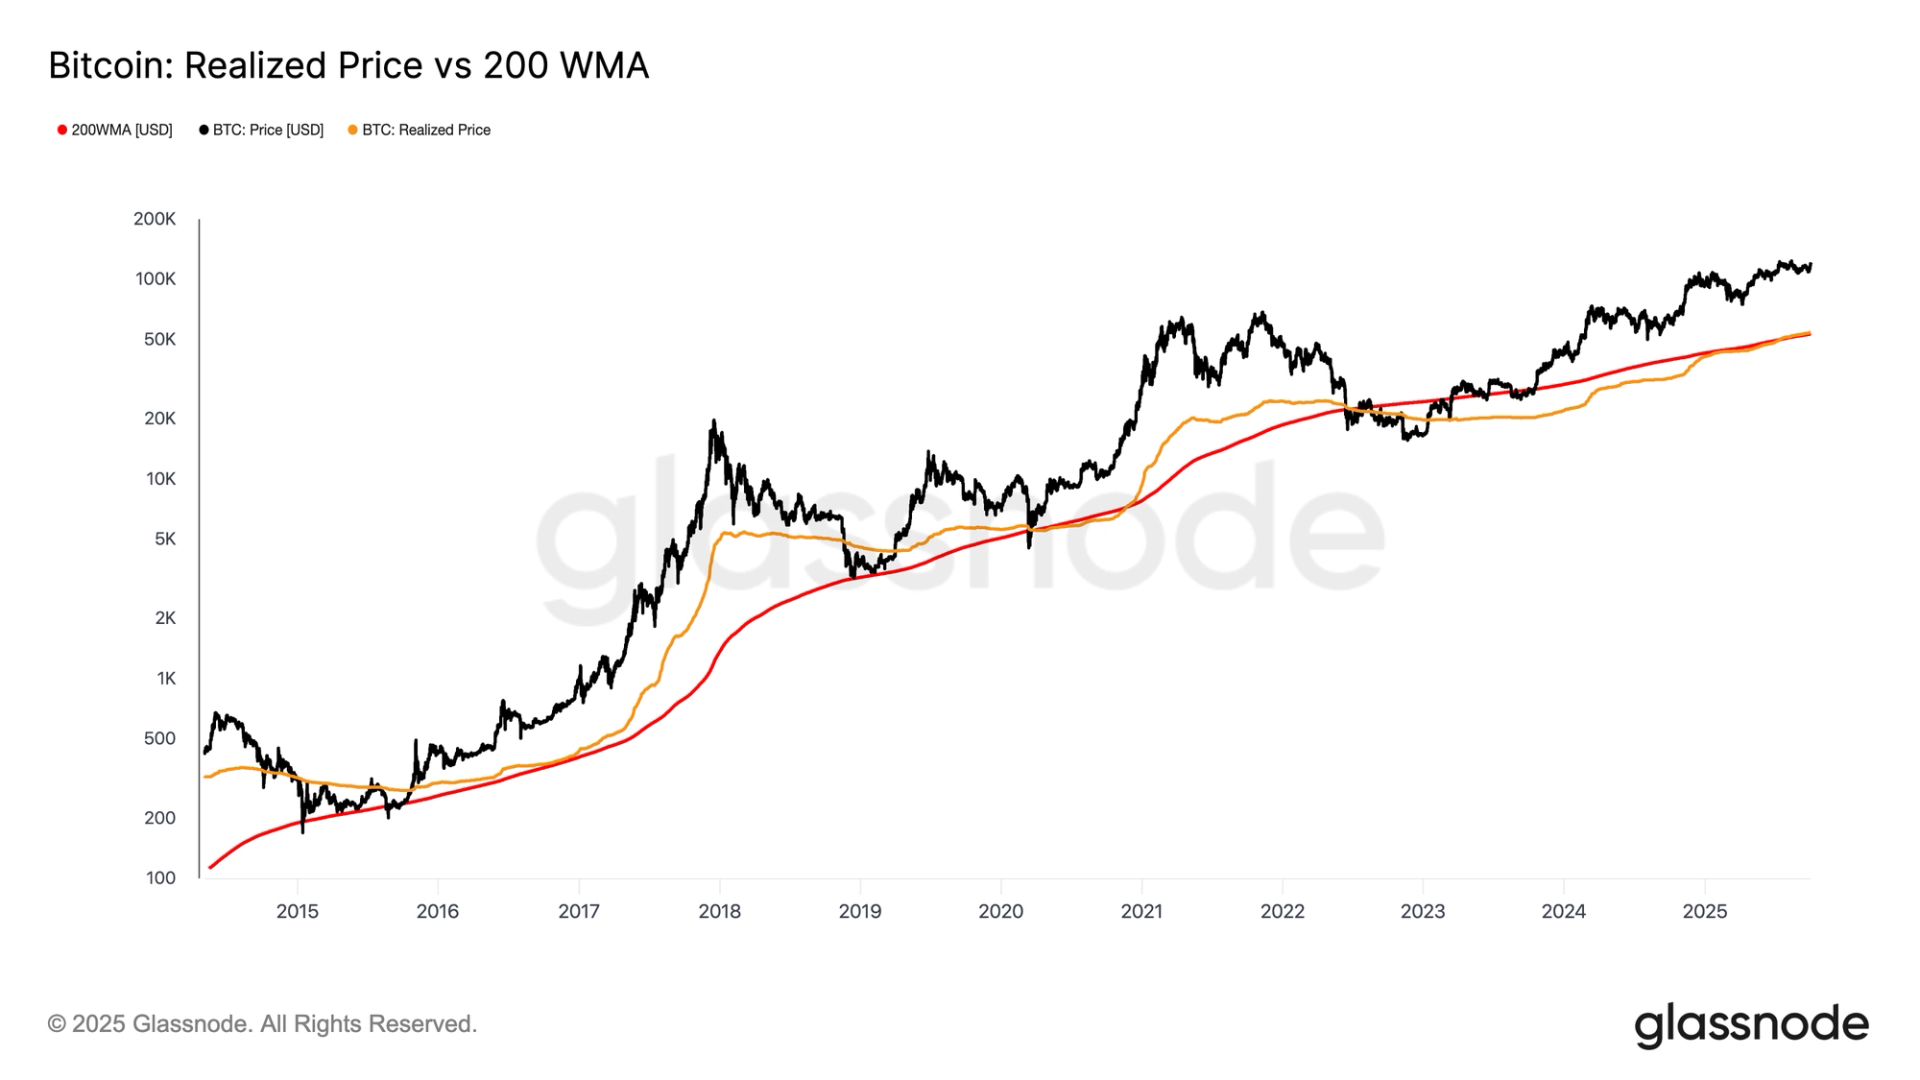

Bitcoin's 200-week moving average (200-WMA) has crossed a new milestone by surpassing $53,000, serving as the only metric that consistently shows an upward trend. At the same time, the average price at which assets are traded in the market has also risen above the 200-WMA at $54,000.
Many investors currently view Bitcoin as the end of a cycle, suggesting that the fourth quarter of 2023 may mark the closure of the current market cycle. However, two key indicators suggest that the bullish market may actually be in its earlier stages.
According to Glassnode data, the 200-week moving average has historically only shown an upward trend while softening Bitcoin's price in the long run. Recent data shows that the 200-WMA has surpassed $53,000. On the other hand, the realized price, known as the average price at which all circulating Bitcoin in the market was last traded, has risen above $54,000 over the 200-WMA.
Looking at previous cycles, a certain pattern can be observed. In bullish markets, the realized price generally remains above the 200-WMA, while the opposite is observed in bearish markets. For instance, during the bullish markets of 2017 and 2021, the realized price consistently rose and widened its gap from the 200-WMA. However, this situation ultimately showed that it fell below the 200-WMA, indicating the start of a bearish market. In the decline of 2022, the realized price fell below the 200-WMA but has recently risen back above it. Historical data indicates that when the realized price remains above the 200-WMA, Bitcoin tends to continue rising as the bullish market progresses.
⚖️ Yasal Uyarı:Bu içerik yatırım tavsiyesi niteliği taşımaz. Yatırımlarınızla ilgili kararlarınızı kendi araştırmalarınız ve risk profilinize göre almanız önerilir.
Bitcoin, 200 weekly moving average, price increase, bull market, investor

İlginizi Çekebilir


.png)