

Stocks Giving Buy Signals in BIST 100: February 5 Analysis

BIST 100 Stocks Giving Buy Signals
As of February 5, 2026, we will examine the stocks in the BIST 100 index that are giving buy signals according to technical indicators. These stocks stand out with their prices being above certain moving averages and other technical indicators being appropriate.
Characteristics of Stocks Giving Buy Signals
Stocks that indicate buy signals according to indicators are defined as having their prices above the 9, 21, 50, and 200-day exponential moving averages, the MACD indicator being above 0, the RSI value being below 60, and the Stochastic and Stochastic RSI values remaining below 70.
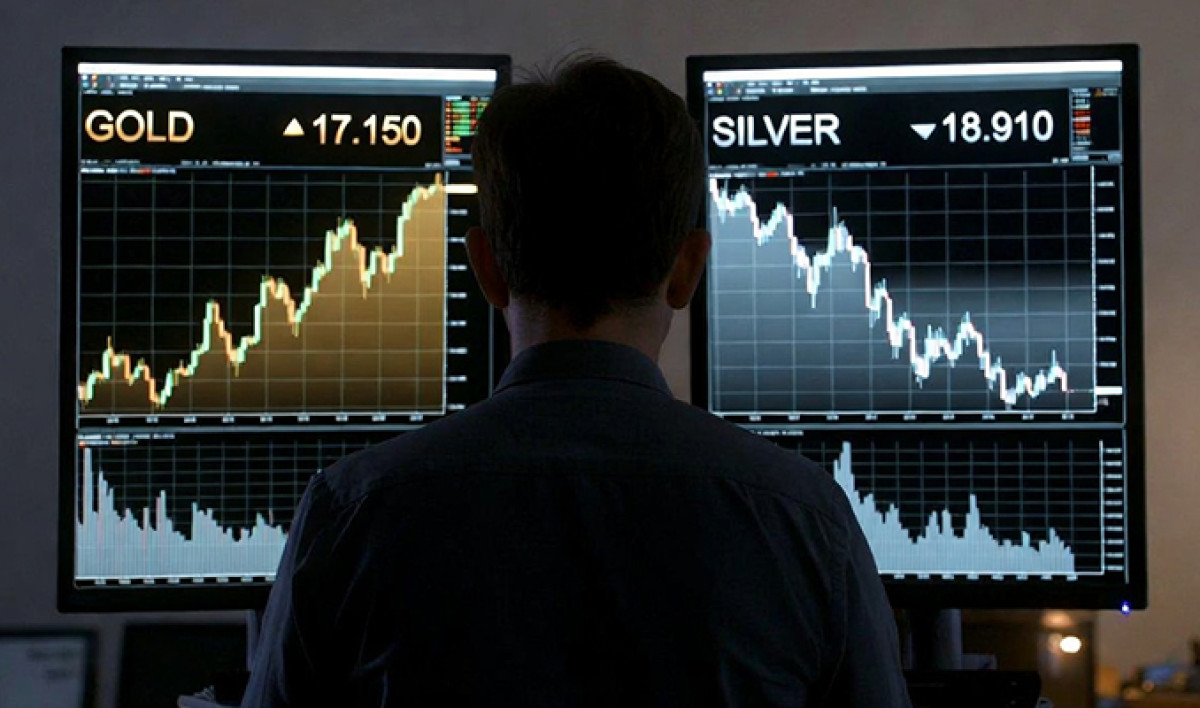
What is Technical Analysis?
Technical analysis attempts to predict future price directions based on past price movements. Various indicators are used in this process; among them are exponential moving averages, MACD, RSI, Stochastic, and Stochastic RSI. These indicators provide investors with information about potential buying or selling opportunities.
Exponential Moving Average and MACD
The exponential moving average gives more weight to recent prices by taking the average of price movements over a specific time period. If the EMA is in an upward trend and the price is close to this average, it is generally interpreted as a buying signal. Similarly, the MACD indicator shows the relationship between short-term and long-term averages. When the 12-day EMA crosses above the 26-day EMA, it indicates a bullish market.
RSI and Stochastic Indicators
RSI assesses the speed of price movements to determine overbought or oversold conditions. An RSI value above 70 indicates overbought conditions, while a value below 30 indicates oversold conditions. Stochastic measures the price momentum, signaling overbought regions between 80-100 and oversold regions between 0-20.
Conclusion
As of February 5, 2026, stocks giving buy signals in the BIST 100 index present significant opportunities for investors who successfully utilize technical indicators. By following these indicators, investors can make more informed decisions in the market.
```Sizin İçin Derlendi


.png)
Yakında Tüm Platformlarda
Sizlere kesintisiz haber ve analizi en hızlı şekilde ulaştırmak için. Yakında tüm platformlarda...
.png)